
Dealer positioning for NQ and ES, laid over a real-time chart and refreshed every minute. See where the market is pinned, where it can run, and which strikes are quietly building.
14 days free, then 30% off your first month ($52.50), then $75/month. Cancel any time.
Veyra puts dealer positioning where you already trade, instead of in a separate tab you forget to check.
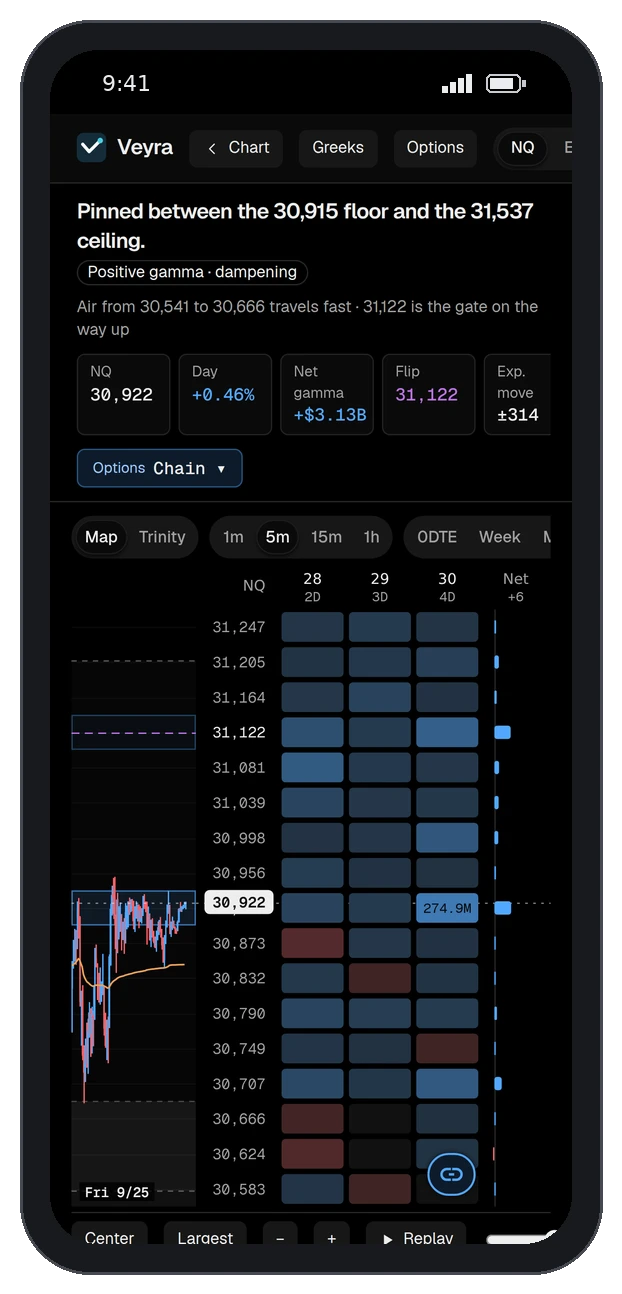
Call wall, put wall, gamma flip and every strike in between drawn over live NQ and ES price, so a level means something the moment it prints.
Strikes in 25-point buckets, heat-shaded by net gamma. Strikes quietly building volume are flagged as likely targets before they become obvious.
Positioning updates through the session, not once at the open. Watch the flip move as flows come in.
A plain-English lean for the session (lean up, lean down, or no edge) graded from gamma, volatility and room to move.
Switch expiries to see which levels matter today versus the ones the whole month is leaning on.
Open it as an app from your home screen. Same chart, same ladder, same levels while you're away from the desk.
Seven tools beyond the chart. Pick one to see it.
Pick a symbol and expiry, let Veyra suggest a starting contract (about 30 delta, a $2–4 premium, or the busiest strike), and buy at the real ask. Calls and puts on SPY, QQQ, SPX, NDX and 20 more names.
What the trade made after fees.
The best price the bid offered while you held.
How far the contract kept going after you sold.
Each trade comes back as a report: what you made, the best exit you had, how much you gave back from the peak, and how far it ran after you sold. Insights point out habits, like holding losers longer than winners.
A ping when price gets within the distance you pick.
A ping the moment price crosses the level.
A ping when a different strike becomes the magnet.
Click the gold bell next to the magnet and choose how you want to hear about it: as price gets close, when it trades through, or when a different strike takes over. You can pin an alert to one price or let it follow the magnet.
The Board log writes down what changed on the positioning map during the day, in plain words. A change has to hold for two snapshots before it is logged, so one-print flickers stay out.
An up arrow on strikes that grew over your window.
A down arrow on strikes that shrank.
The Movers list sorts the biggest changes.
Small arrows on the heatmap show strikes that got heavier or lighter over the window you pick, from one minute to a day. The Movers list ranks the biggest changes.
Claim the Veyra indicator through Whop with your TradingView username, then paste the day's levels from the map. They draw on SPY, QQQ, SPX and NDX, and convert onto NQ, ES and the micros by themselves.
Each play lists what has to be true on the board.
Entry, stop and target drawn on the chart.
The options-implied chance price gets there today.
Six plays the dealer map supports, each with its checklist, a plan and the options-implied chance price reaches the target today. Scan every symbol at once. Educational, not signals.
Everything on the screen answers one question: which way is the path of least resistance today, and where does it stop?
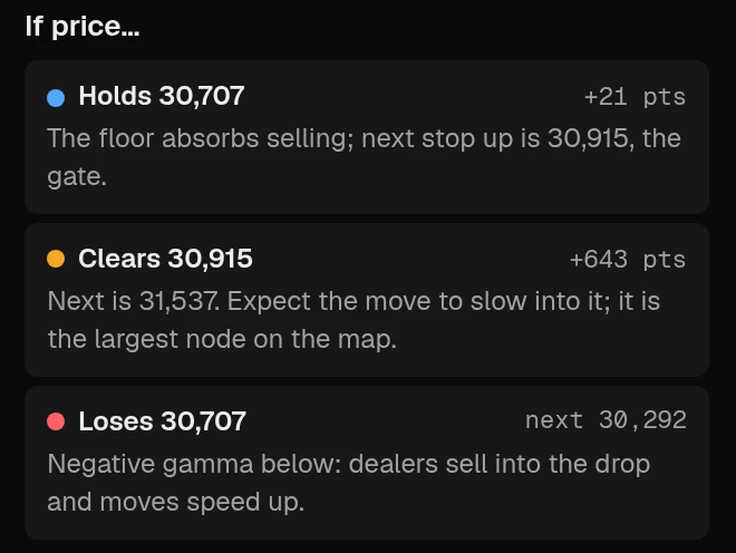
What happens if price holds, clears or loses each level, in plain words.
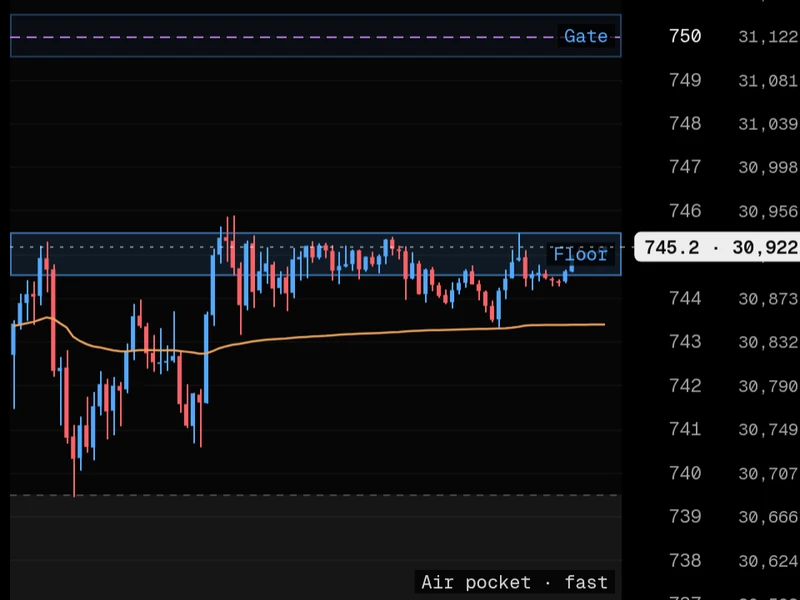
Gate, floor and air pockets drawn right on the candles, so you never have to translate a number to a chart.
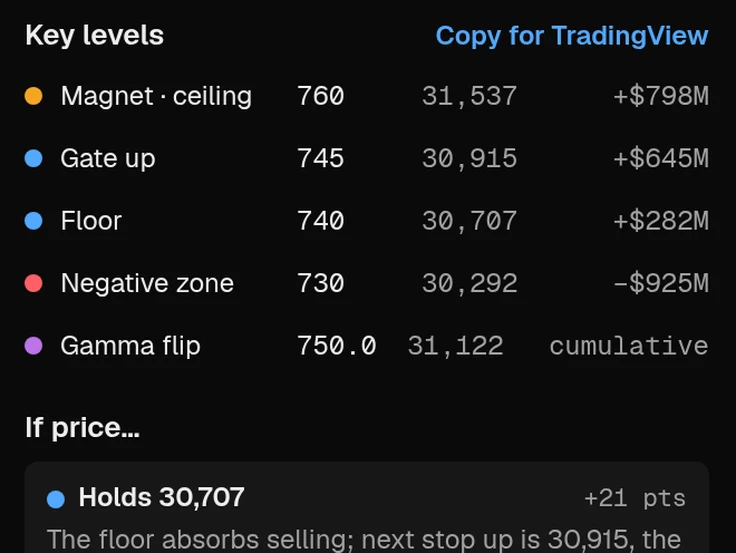
Strikes ordered by strength and persistence, with the gamma behind each one.
Session bias, ranked levels and the chart on desktop. The same ranked list and chart on your phone, one thumb wide.
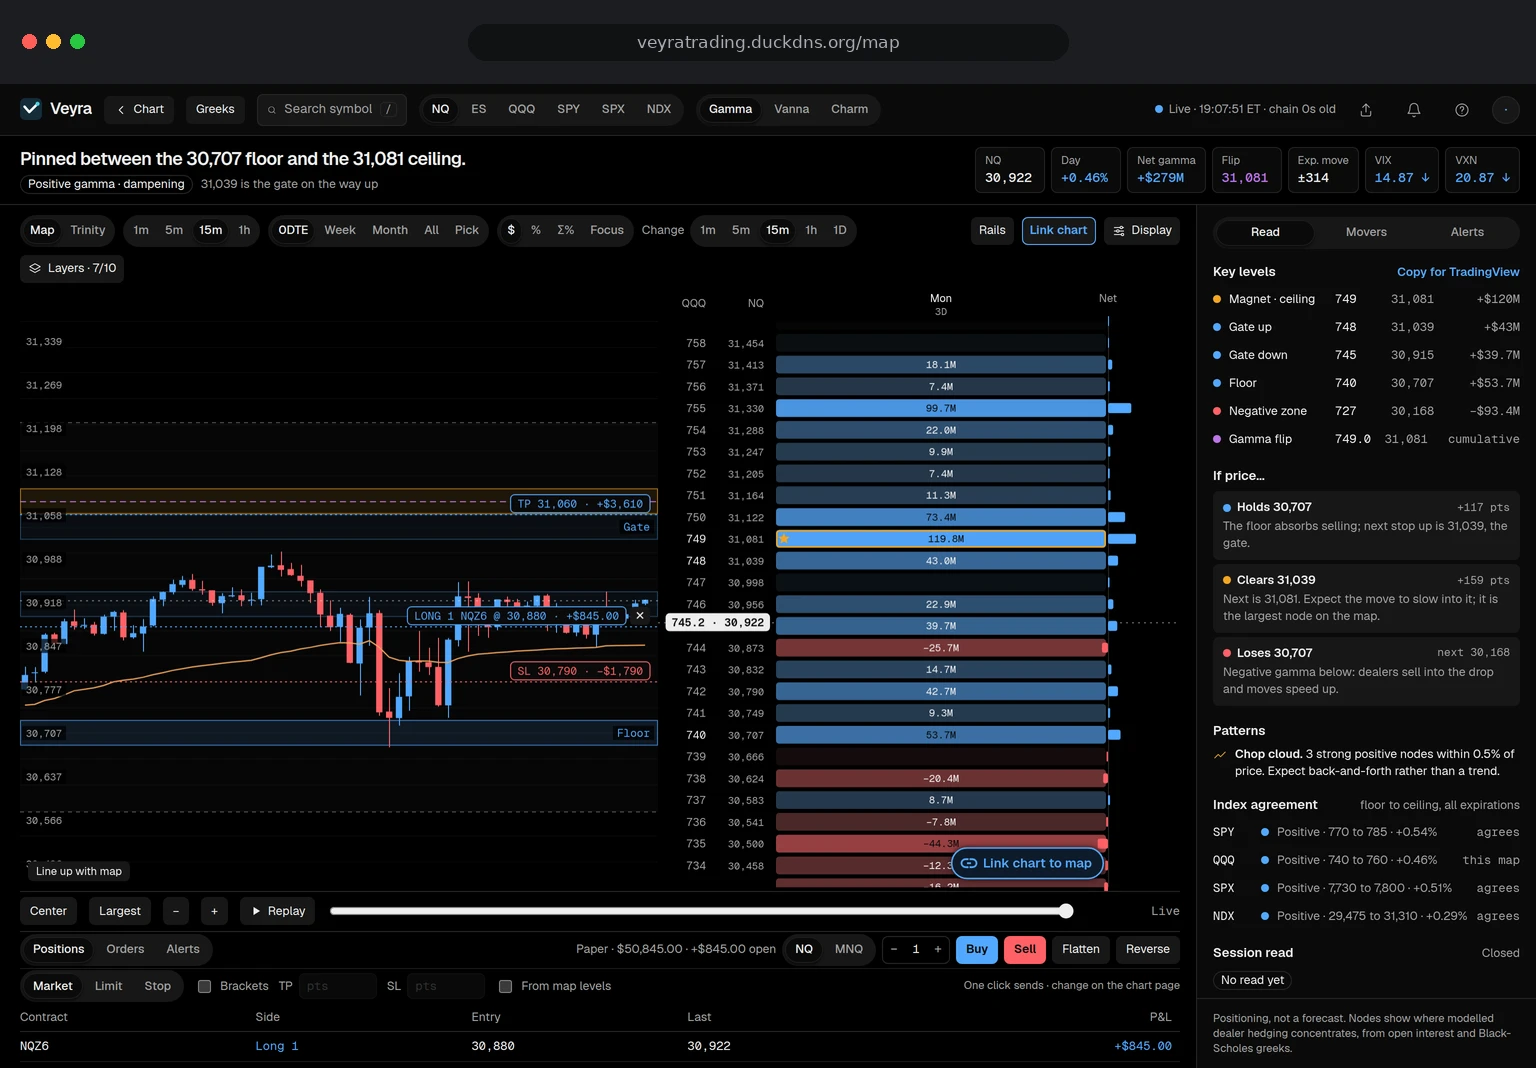
From the options book to a line on your chart, about once a minute.
Every strike and expiry on SPX, NDX, SPY and QQQ: open interest, volume and implied volatility, pulled through the session.
Net gamma per strike tells us where hedging slows price down and where it speeds it up: the magnet, the walls, the flip and the air pockets.
Mapped onto NQ, ES and the micros and drawn right on the candles, the map and your TradingView chart. They update in place; no refresh.
Try it through ten full sessions before you decide.
14 days free, then your first month is 30% off, applied automatically.
Check out with the email you want for Veyra; access is sent there.
Billed monthly through Whop. Renews automatically each month until you cancel. Cancel any time from your Whop account and you keep access to the end of the month you've paid for.
All sales are final. If something isn't working the way it should, message us on Discord or through Whop and we'll make it right.
When traders buy and sell options, market makers take the other side and hedge with futures. Where that hedging clusters creates levels where price tends to slow down, get pinned, or accelerate. Veyra shows you those levels.
No. The chart shows three things: where price is likely to stall (walls), where it is likely to speed up (below the flip), and which strikes are gathering interest. The ladder is there if you want the detail.
NQ and ES, including the micro contracts, plus SPX, NDX, SPY and QQQ. Levels are computed from the options chains and drawn on whichever contract you chart.
The options board refreshes through the session, about every minute, and the chart, map and tags update in place.
A playbook of six trade ideas the dealer map supports, like a pull toward a large long-gamma strike or a fade at a wall. Each one shows its checklist, a plan with entry, stop and target, and the options-implied chance of reaching the target. They are educational, not signals.
You can practice. Futures paper trading runs on the map, and options paper trading gives you a $100,000 practice wallet on live option quotes. Real orders go through your own broker.
Yes. Claim the Veyra indicator in your Whop account with your TradingView username, then copy the day's levels from the map and paste them into its settings. They draw on SPY, QQQ, SPX and NDX, and map onto NQ, ES and the micros on their own.
Yes: $720 a year, which works out to $60 a month and saves 20% against paying monthly. It comes with the same 14-day trial.
On the monthly plan your first month is $52.50 (30% off), then $75 a month. On the annual plan you pay $720 for the year. If you cancel before the 14 days are up, you are not charged.
From your Whop account, any time, in a couple of clicks. You keep access until the end of the period you've paid for, and nothing renews after that.
All sales are final. If something is wrong, with the product or with a charge, message us on Discord or through Whop and we'll sort it out.
No. Veyra is a data and charting tool. Levels are context, not signals, and futures trading involves substantial risk of loss.